Statistical Measures of Random Variables
We use different metrics to summarize random variables. The measures used to describe random variables are different for continuous variables and others. For quantitative variables especially quantitative variables, we use Mean, Median and Mode to measure the central tendency. To measure the dispersion, range, quartiles, standard deviation and variation are used. Lets see each of them in detail (here lets consider random variables to be observations that form a dataset for ease of explanation).
Measures of Central Tendency: Central tendency refers to the central value of the data. This can be represented in different ways, it can be the average value or the central value of the value shown by different data points. This is measured in 3 ways.
- Mean: This is average of all the data
- Median: The central value of the data
- Mode: The value that is repeated highest number of times.

The figure is an example showing the mean, median, and mode using a probability distribution of a random variable. Suppose, this distribution represents the marks obtained by students in a test. Then mode represents the marks that are obtained by the highest number of students. Median represents the central mark when we arrange the marks in ascending or descending order, finally mean is the average marks of all the students.
Measures of dispersion: While the central tendency measures the central (or typical) value, the dispersion measures represent the variation in the data. this is measures by the following measures.
- Range: This refers to set of all the possible values, for a random variable. But, in some cases, the range of a quantitative variable also reference to the difference between the highest and the lowest possible values
- Quartiles: As there could be some outliers in the data representing the random variable, range is not better representation of the quantitative variables. In such cases (with outliers), we use quartile measures to describe the data. The quartiles are the values of the random variables (or data) which represent the 25 percentile and 75 percentile values.
- Standard deviation: the standard deviation is a measure of the amount of variation or dispersion in the data. A low standard deviation indicates that the values tend to be close to the mean (also called the expected value) of the set, while a high standard deviation indicates that the values are spread out over a wider range.

The figure on the right presents two distributions with same mean, while one with standard deviation of 10 (red) and other with 50 (blue). The lower standard deviation (red) indicates that the values are closer to the mean, while the one with higher distribution (blue) has the values spread out over a larger range.
Note: the standard deviation is sensitive to outliers.
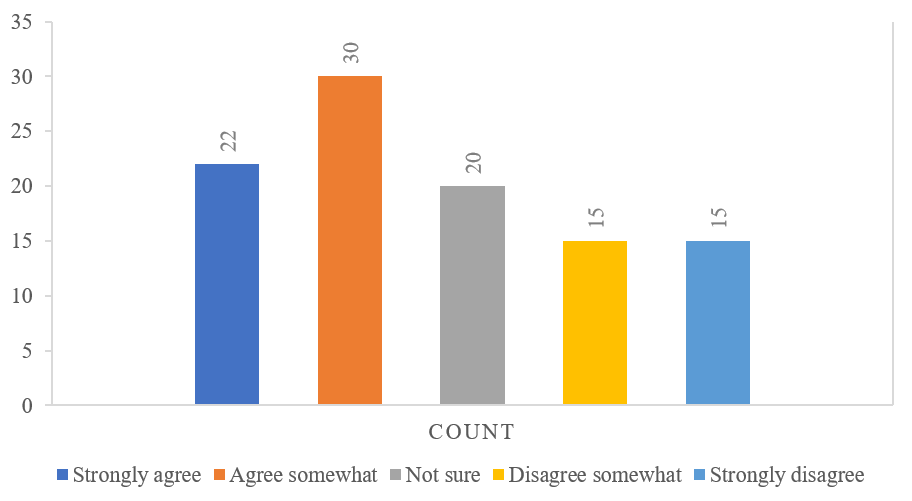
The Qualitative does not have as many measures as that of qualitative variables. The qualitative variables are measured by frequency distributions. The frequency is the number of times an item or outcome has repeated in the data.
If a data collected from a group of users about their experience, it can be summarized to a frequency table and can be plotted as below
| Rank | Satisfaction | Count |
| 1 | Strongly Agree | 22 |
| 2 | Agree | 30 |
| 3 | Neutral | 20 |
| 4 | Disagree | 15 |
| 5 | Strongly Agree | 15 |